The Register Tab: Your Daily Command Center
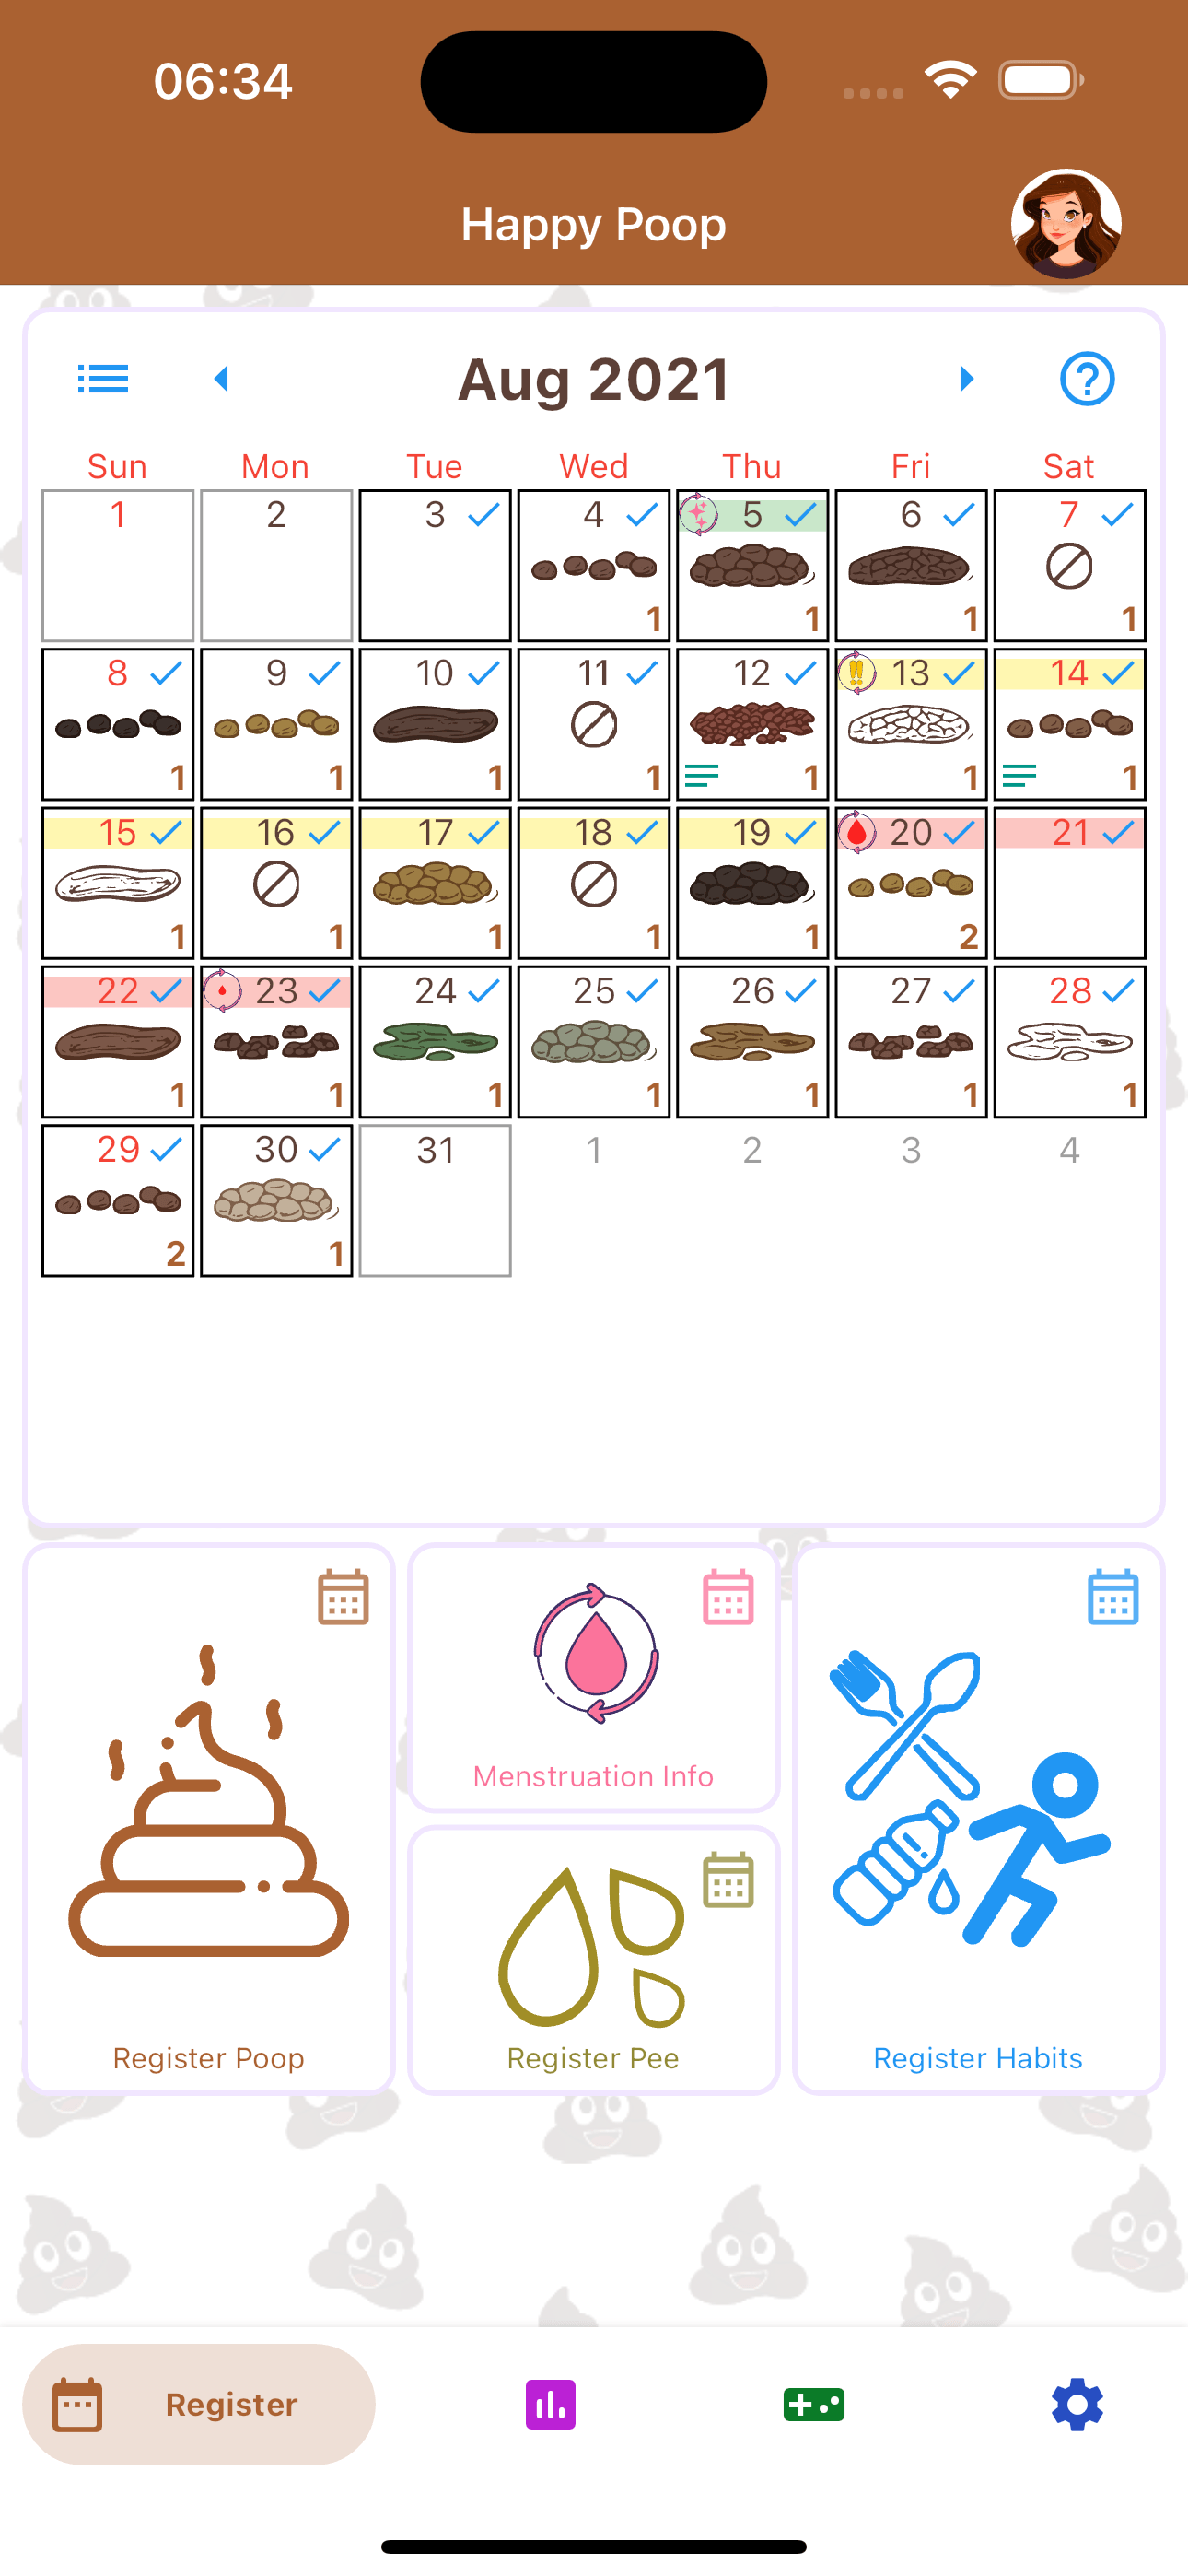
At the heart of Happy Poop is the Register tab. Designed for speed and simplicity, this interface is where you will input your daily health metrics. The screen is divided into two primary functional areas: the Interactive Calendar and the Quick-Log Buttons.
The Interactive Calendar
The top half of the Register tab features a comprehensive calendar view. This provides a temporal overview of your logging history at a glance. Days with logged entries are clearly marked, allowing you to instantly assess your consistency. Tapping on any specific date in the calendar will bring up the detailed records for that day, allowing for quick reviews or retrospective edits to past entries.
The Four Quick-Log Categories
Directly beneath the calendar are four distinct buttons, each representing a core pillar of your trackable data:
- Poop: Log your bowel movements using the medically recognized Bristol Stool Scale. You can record the exact time, duration, and volume.
- Pee: Track your hydration levels by logging urination frequency, volume, and color variations.
- Habits: Beyond bathroom visits, you can log custom daily routines—such as water intake, medication adherence, or dietary choices.
- Menstruation: A dedicated module for tracking menstrual cycles, flow intensity, and related symptoms.
Anatomy of a Log Entry
When you click a logging button, you are presented with a detailed, yet easy-to-navigate input screen. To accommodate busy schedules, only the Quantity and Type are mandatory fields, but you can capture highly specific data by utilizing the optional parameters:
- Date & Time: Automatically logs the current time, but allows you to adjust the specific End Time and total Duration of your visit.
- Location: Track where you are most comfortable. You can select standard tags like "Home" or "Work," or create custom location tags. (Note: This is a private, user-defined text tag, not a GPS coordinate).
- Quantity & Type: Select the volume and categorize your entry using the standard Bristol Stool Scale.
- Secondary Type & Color: Crucial for identifying dietary or digestive changes.
- Custom Traits & Mood: Tag your entry with your current mood, or select specific medical traits such as the presence of blood, mucus, colic pain, or specific medications taken. You can also create entirely custom traits.
- Photographic Attachments: For users who need visual documentation (often recommended for tracking dietary reactions or for discussions with a gastroenterologist), you can securely capture or upload a picture directly to the log entry. These images are stored privately and only visible to your followers if you chose to share poop pictures with them.
- Text Notes: A free-form text box for any additional context you wish to remember.
Once your parameters are set, simply click "Save" and the entry is immediately added to your timeline.
Editing and Managing Your History
Mistakes happen, or you may remember additional details after logging an entry. Managing your historical records is simple.
Whenever an entry is saved, it populates on the Interactive Calendar in the Register tab. To modify past data:
- Tap on the specific day within the calendar grid to reveal a list of all entries recorded on that date.
- Tap on the individual entry you wish to modify. This will reopen the original logging screen with all your previously saved parameters populated.
- Make your necessary adjustments and click Save, or utilize the trash can icon located in the upper-right corner of the screen to permanently delete the record.
Advanced Logging and Customization
We understand that standard metrics do not cover everyone's unique health journey. Happy Poop is engineered to be fully adaptable to your specific needs.
Beyond the Bristol Scale: Custom Traits
While the app utilizes the standard Bristol Stool Scale as a baseline, you are not limited to default options. Users can create Fully Customizable Traits and Types. Whether you need to track specific dietary reactions, pain levels, or custom visual descriptors, you can add these modifiers to your logging screen. Once created, these custom traits become selectable options for all future entries.
Setting Profile Defaults
If you find yourself logging similar data frequently, you can save time by setting default values. By navigating to your profile settings, you can establish standard defaults for type, quantity, and specific traits. This means your most common entry types are pre-selected the moment you open the log screen, reducing friction and encouraging consistent tracking.
The Dashboard Tab: Analyzing Your Health Trends
Data is only useful if you can understand it. The Dashboard tab is your analytical hub, transforming your raw daily entries into actionable health insights. Upon opening the Dashboard, you are immediately presented with a summary of your most recent entry.
From the main Dashboard view, you can access three powerful analytical tools:
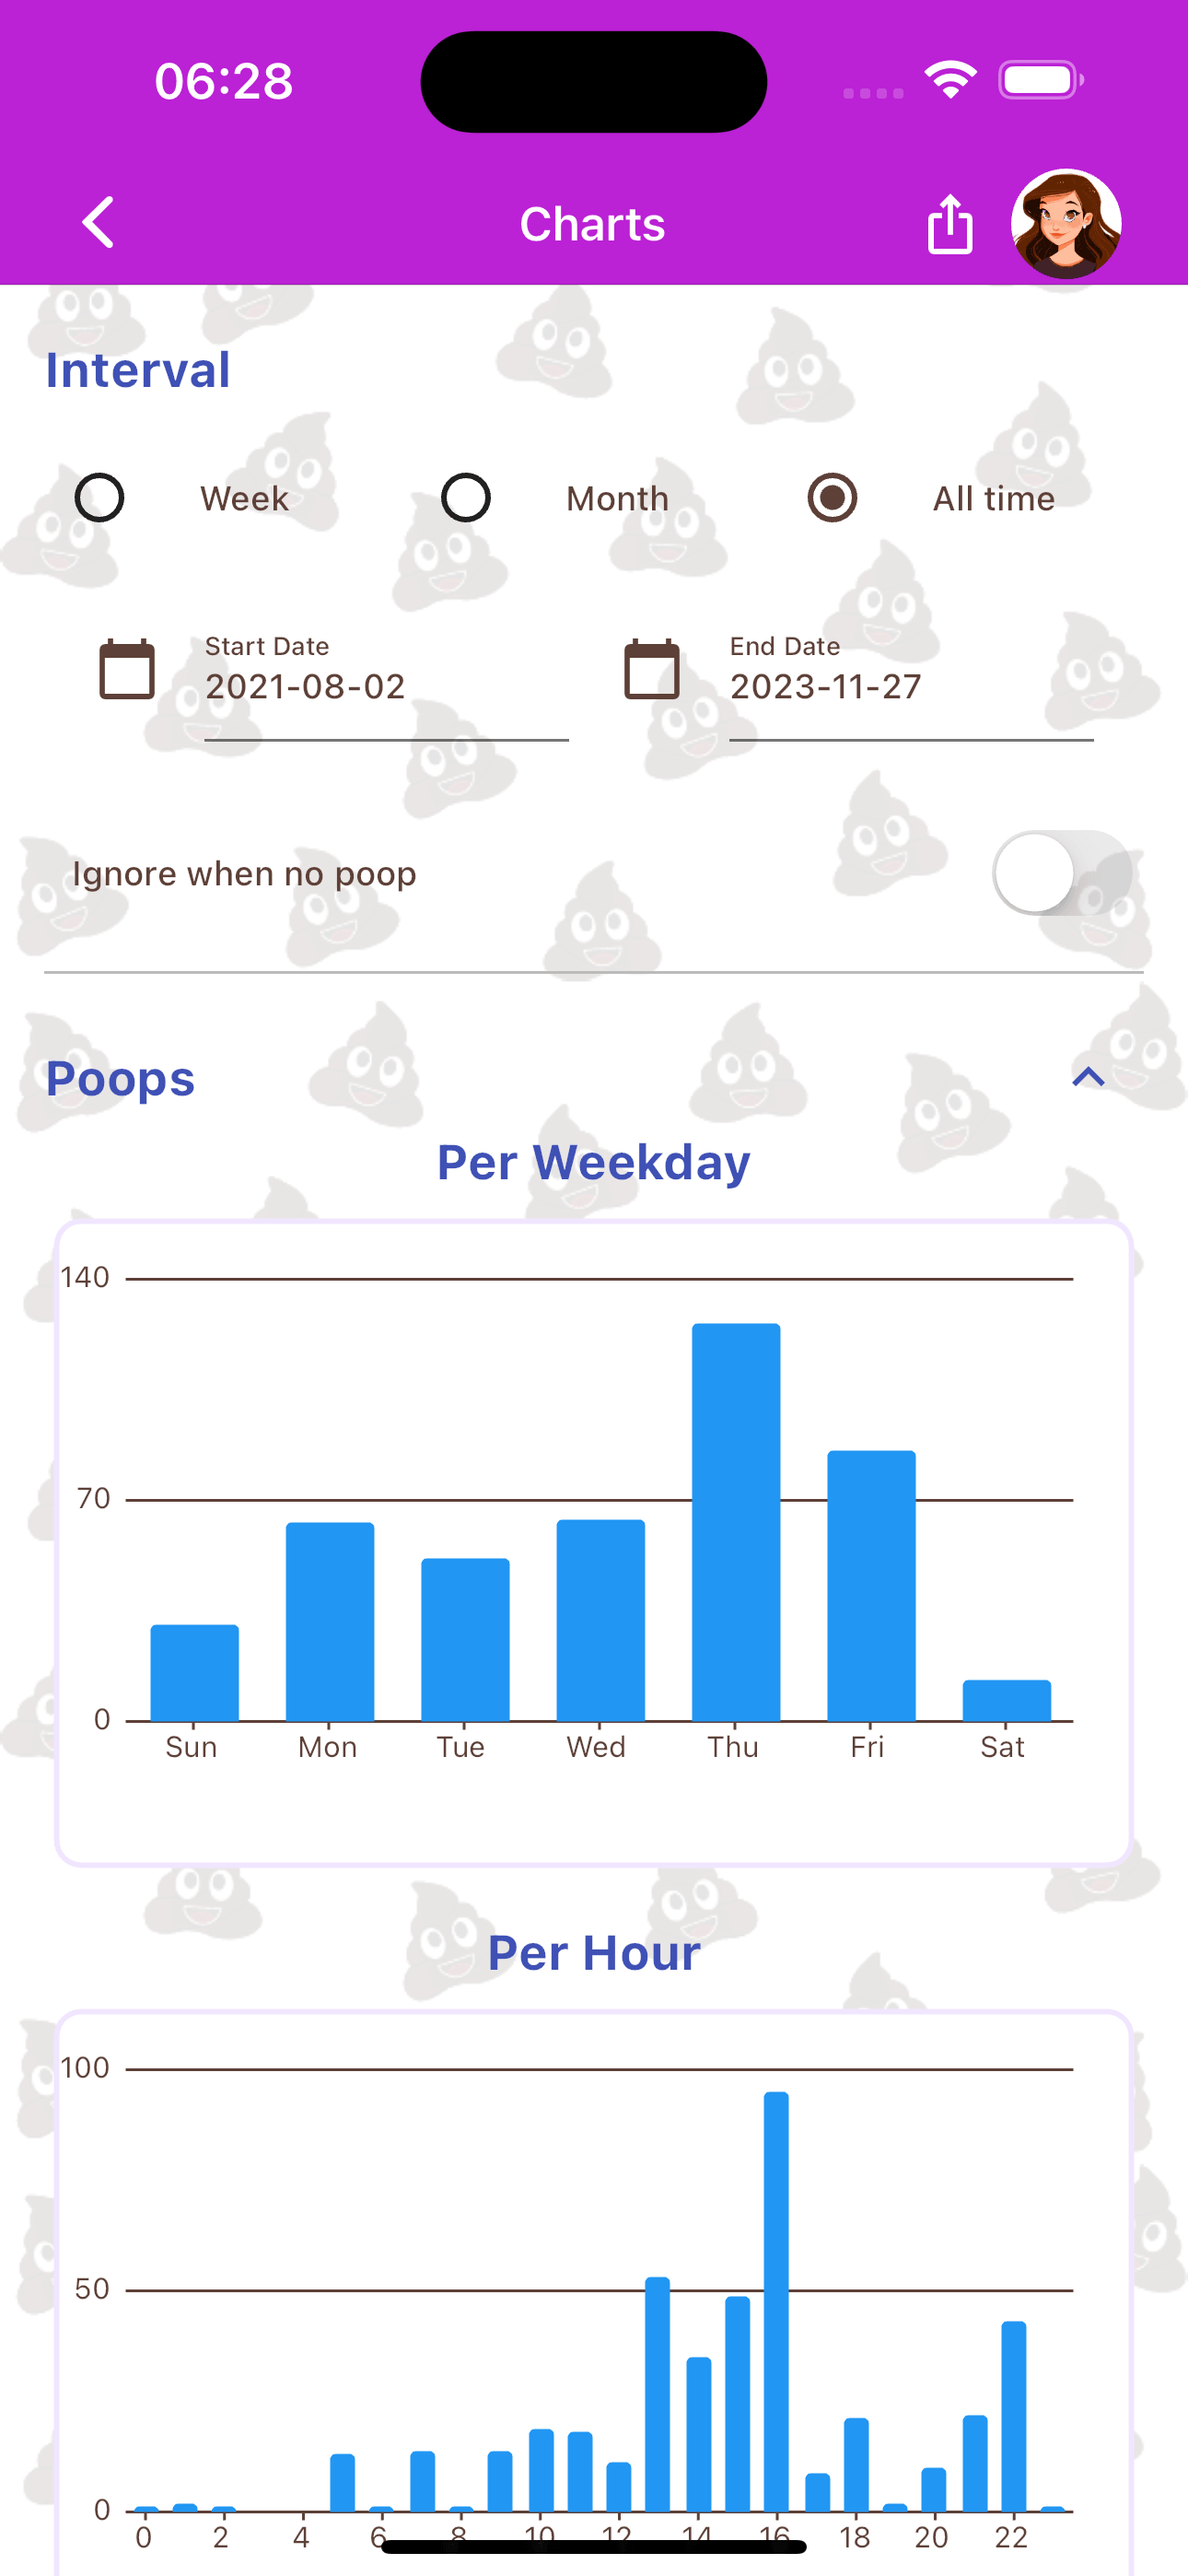
1. Charts
Visual learners can dive into the Charts section to see their data plotted over time. This is invaluable for spotting long-term trends. You can filter charts to show the frequency of specific Bristol Scale types, the correlation between custom habits and bowel movements, or track your hydration levels over weeks and months.
The system generates highly specific charts breaking down your activity. You can view your statistics sorted by weekday, time of day (hour), Bristol type, custom location, color, mood, quantity, specific traits, and average duration. All of these metrics are available for both poop and pee entries.
One of the most powerful features in the Dashboard is the multi-data overlay. This specialized chart allows you to select poop, pee, and custom habits simultaneously, plotting them on a single graph. This makes it incredibly easy to visualize holistic trends and discover correlations—such as how a specific habit (like increased water intake) directly impacts your other tracked metrics.
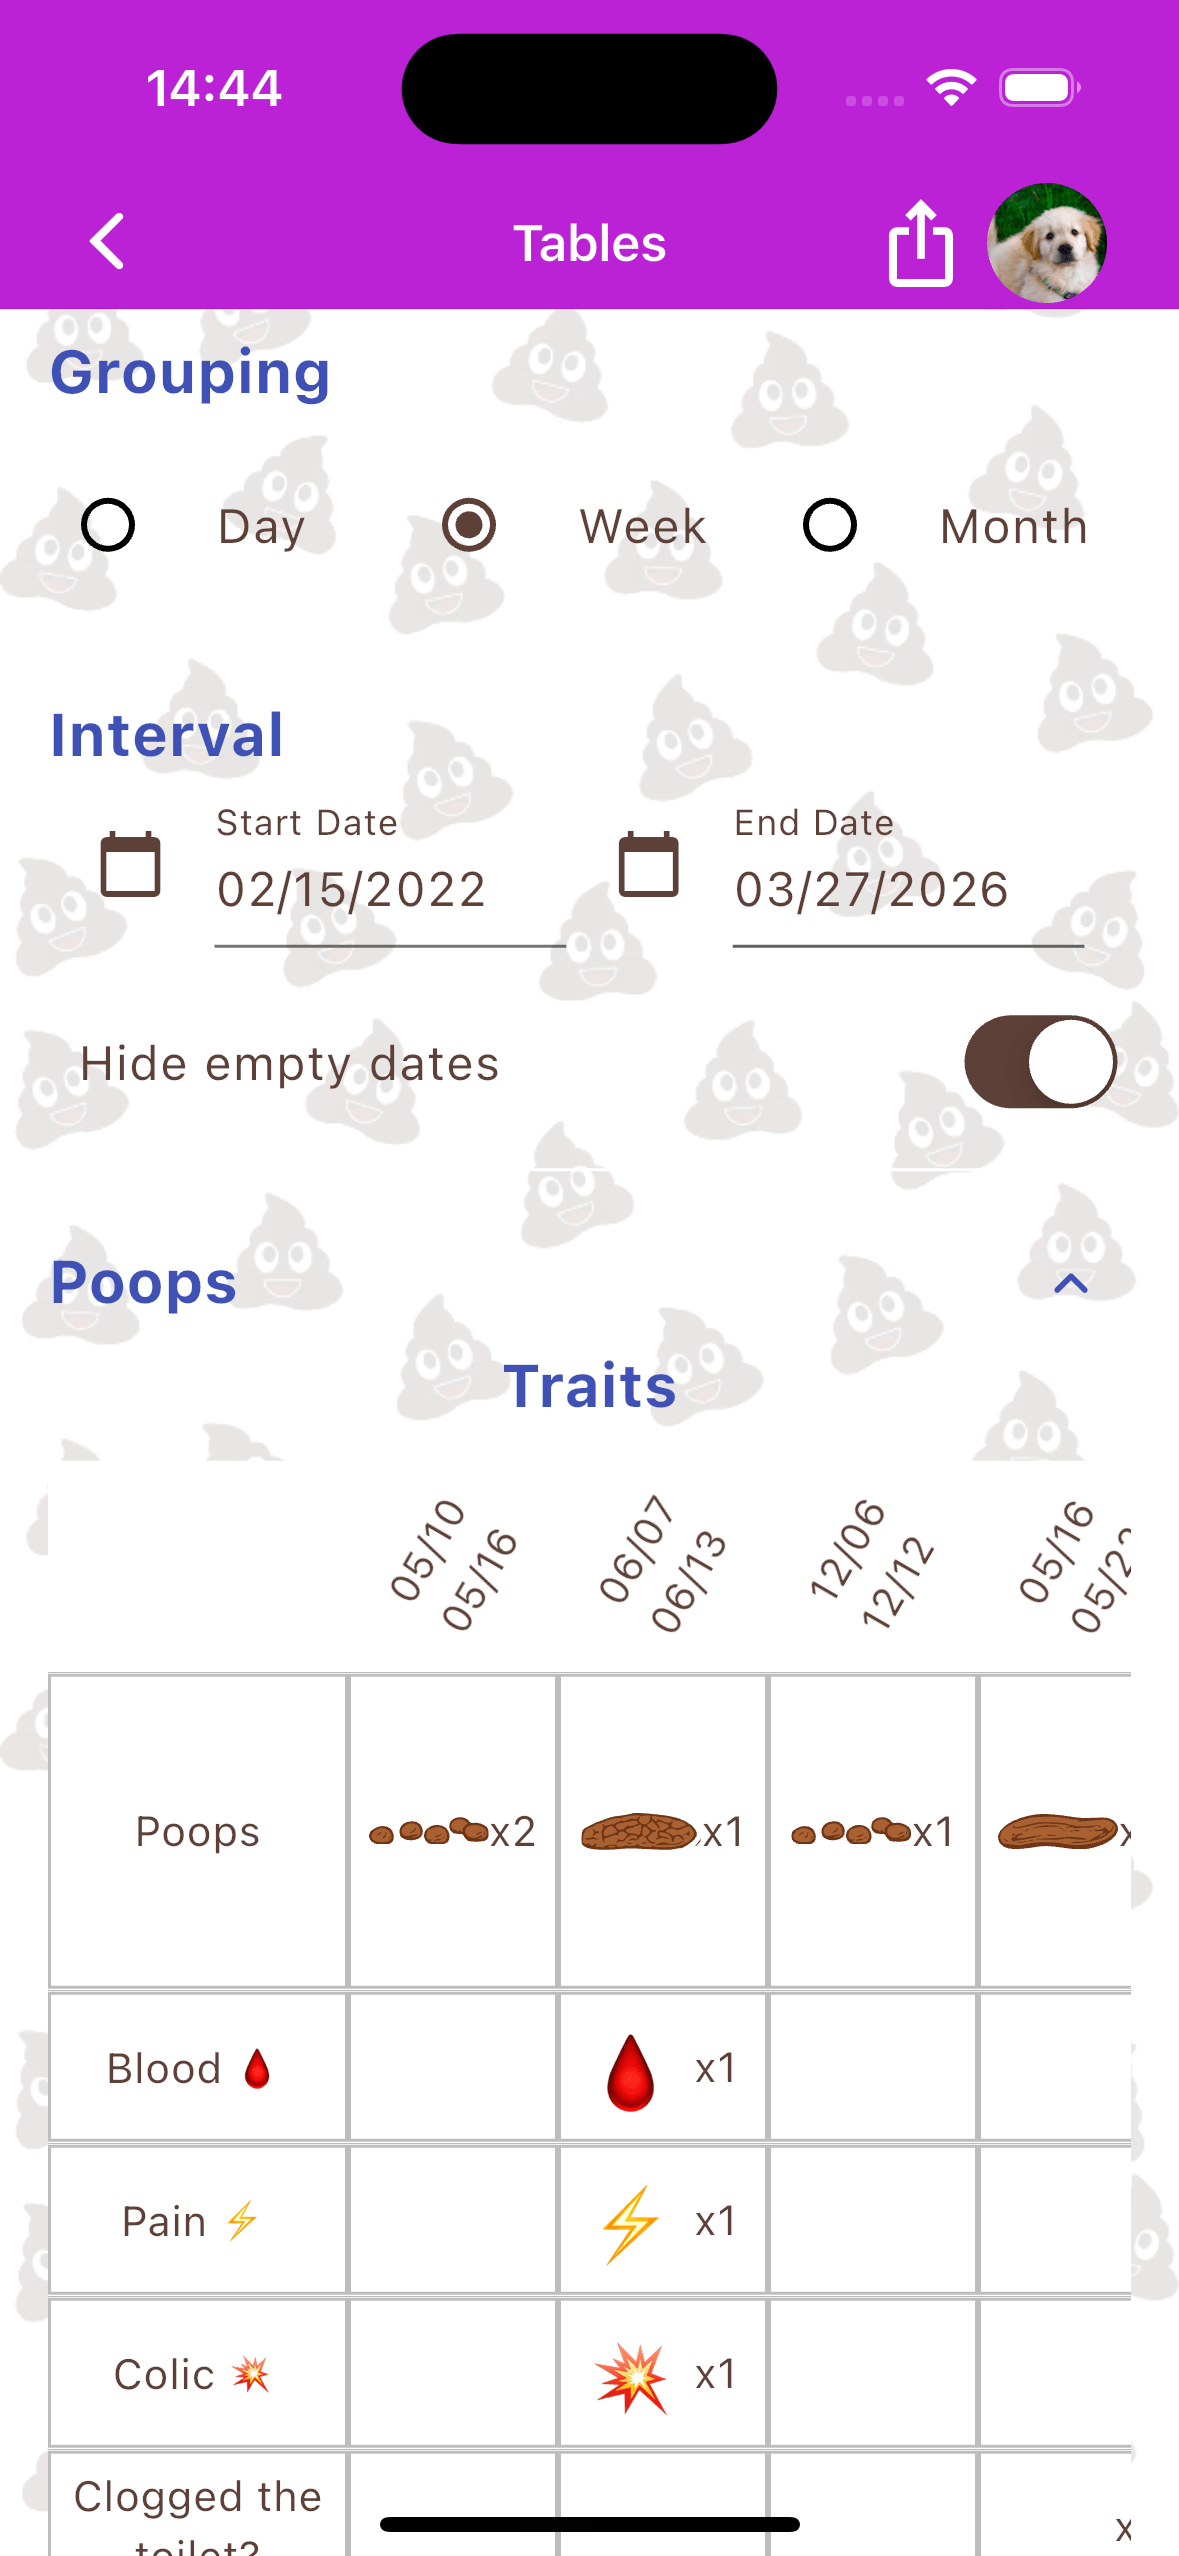
2. Tables
For users who prefer raw data, the Tables section compiles your entries into clean, spreadsheet-style rows and columns. This view is excellent for comparing day-to-day variances side-by-side.
3. Records
The Records section highlights your statistical extremes and averages. Discover your most frequent logging times, your longest streaks of consistent tracking, and aggregate totals for customized date ranges.
For users working alongside healthcare professionals to diagnose issues or guide treatments, you can easily export these Dashboard statistics directly into a cleanly formatted PDF document to share during your medical consultations.
Notifications and Data Migration
Consistency is the key to meaningful health data. To help you build a routine, Happy Poop features a robust reminder system.
Custom Daily Notifications
You can configure personalized daily notifications to remind you to log your activity. Unlike rigid alarm apps, you have total control over the messaging and timing of these reminders, ensuring they fit seamlessly into your daily schedule.
Importing Historical Data
Are you migrating from another tracking application or a physical journal? You don't have to start from scratch. Happy Poop supports data importation from other popular poop and health trackers. By utilizing our import tool, you can seamlessly integrate your historical data into the Happy Poop ecosystem, ensuring your long-term charts and statistics remain uninterrupted.